Follow-up of transport policy objectives 2020
In this report, Transport Analysis analyses the current state of the transport system in terms of the government's specifications. Transport Analysis also presents its assessments as to how the state has changed in terms of these specifications.
A slow-moving transport system
After 10 years with new transport policy goals, we can see in this year's follow-up report that although the margin is constantly developing rapidly, the transport system as a whole is quite slow-moving. Of the 15 indicators for a long-term sustainable transport system that we follow, there are nine indicators according to this year's follow-up that do not show any clear direction of development towards or away from the goals.
People's travel patterns and travel habits have been quite unchanged. Despite all the better technical conditions, distance work from home has not previously had a really broad impact. The situation now prevailing as a result of the corona pandemic means that many people are now for the first time starting to use the opportunities for teleworking and travel-free meetings that are available. The question is whether the experience of this will lead to changed work and travel patterns even in the longer term. Regardless, we can expect that many measures in our follow-up next year will be affected by the effects of the pandemic on the economy and working life.
The state of the transport system 2019
There are remaining non-internalized costs for different types of transport and traffic. This entails a risk that society will over-consume transport compared to what would be most economically efficient. At the same time, with the carbon dioxide valuation that applies in 2019, certain transports, especially outside our urban areas, are clearly over-internalized, and neither over- or under-internalization contributes to socioeconomic efficiency.
The conditions for business transport are estimated to have weakened since the targets were adopted. When it comes to citizens accessibility, it is improving across the country, although development is not as rapid throughout the country, mainly thanks to improved accessibility without transport. The cost of using the system has indeed increased over time, but by controlling for welfare improvement in the form of increased per capita GDP, the transport system's affordability generally seems to have developed positively.
The negative impact of the transport system on the landscape and wildlife is not considered to have diminished.
The goals of reducing the number of fatalities in traffic do not appear to be achieved in a timely manner, and the same seems to apply to the goal of reducing greenhouse gas emissions.
All in all, Traffic Analysis considers that the transport supply, in accordance with the overall target, has developed negatively since the targets were adopted. Although that assessment is firm and unchanged since last year, there are reasons to note that a number of the key measures that guide the weighted assessments show that the transport system has developed in a sustainable direction.
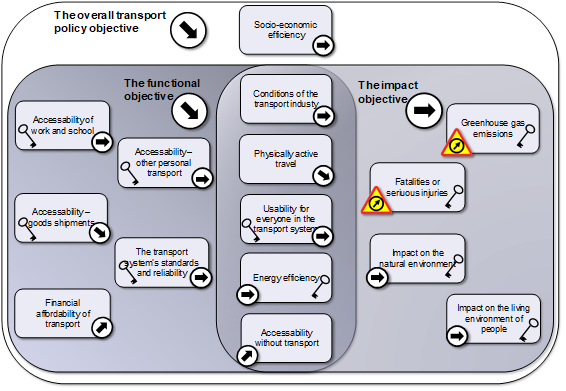
Figure A. Overall assessments of indicators and objectives. An upward-pointing arrow means that the indicator or objective has developed in the desired direction since the transport policy objectives were adopted in 2009. A downward-pointing arrow indicates that the development trend has, at least in some respects, been away from the objective. A horizontal arrow indicates that our overall assessment is that the relevant status within the transport system is approximately the same as when the objectives were adopted.
Clear changes compared to last year's follow-up
For the transport system standard and reliability indicator, the assessment has been changed from a negative to a neutral arrow. Last year, the assessment was lowered to a negative arrow, which was partly explained by a poor reliability in train traffic. This trend was reversed in 2019 and reliability improved significantly.
The assessment has also been changed for the financial affordability of the transports. In previous years, we have not taken into account the development of income or GDP per capita, as we have done this year. The assessment of "Usability for All" has also changed, from negative arrow to neutral. New measures to measure accessibility for people with disabilities have been introduced as of this year's report.